Arduino GPS Tracking System
When your out and about it can sometimes be handy to create a log of where you’ve been, what speeds you have been doing and how long you have been travelling. For example monitoring your workforce while they are out and about in their company vehicles, or preserving a record of that bike ride of Olympic proportions for posterity.
The Matrix TSL EB056 GPS E-block allows for a very flexible approach to adding GPS functionality to your embedded device. It comes with a highly sensitive UP500 GPS receiver module, which is capable of tracking the location of up to 30 satellites, logging altitudes of –300m to 18,000m and also velocities of up to 515m/s. The module even works perfectly well in most indoor environments, which is something that the last generation of GPS receivers were never very good at doing.
To demonstrate the functionality of the GPS E-block we have created a simple logging program that combines the functionality of the GPS along with the storage of the SD/MMC card reader E-block. The program is fairly simple and just involves sampling the GPS coordinates and then storing to the memory card. As we do not need to sample very fast, the slow but easy card writing method is being used in the program.
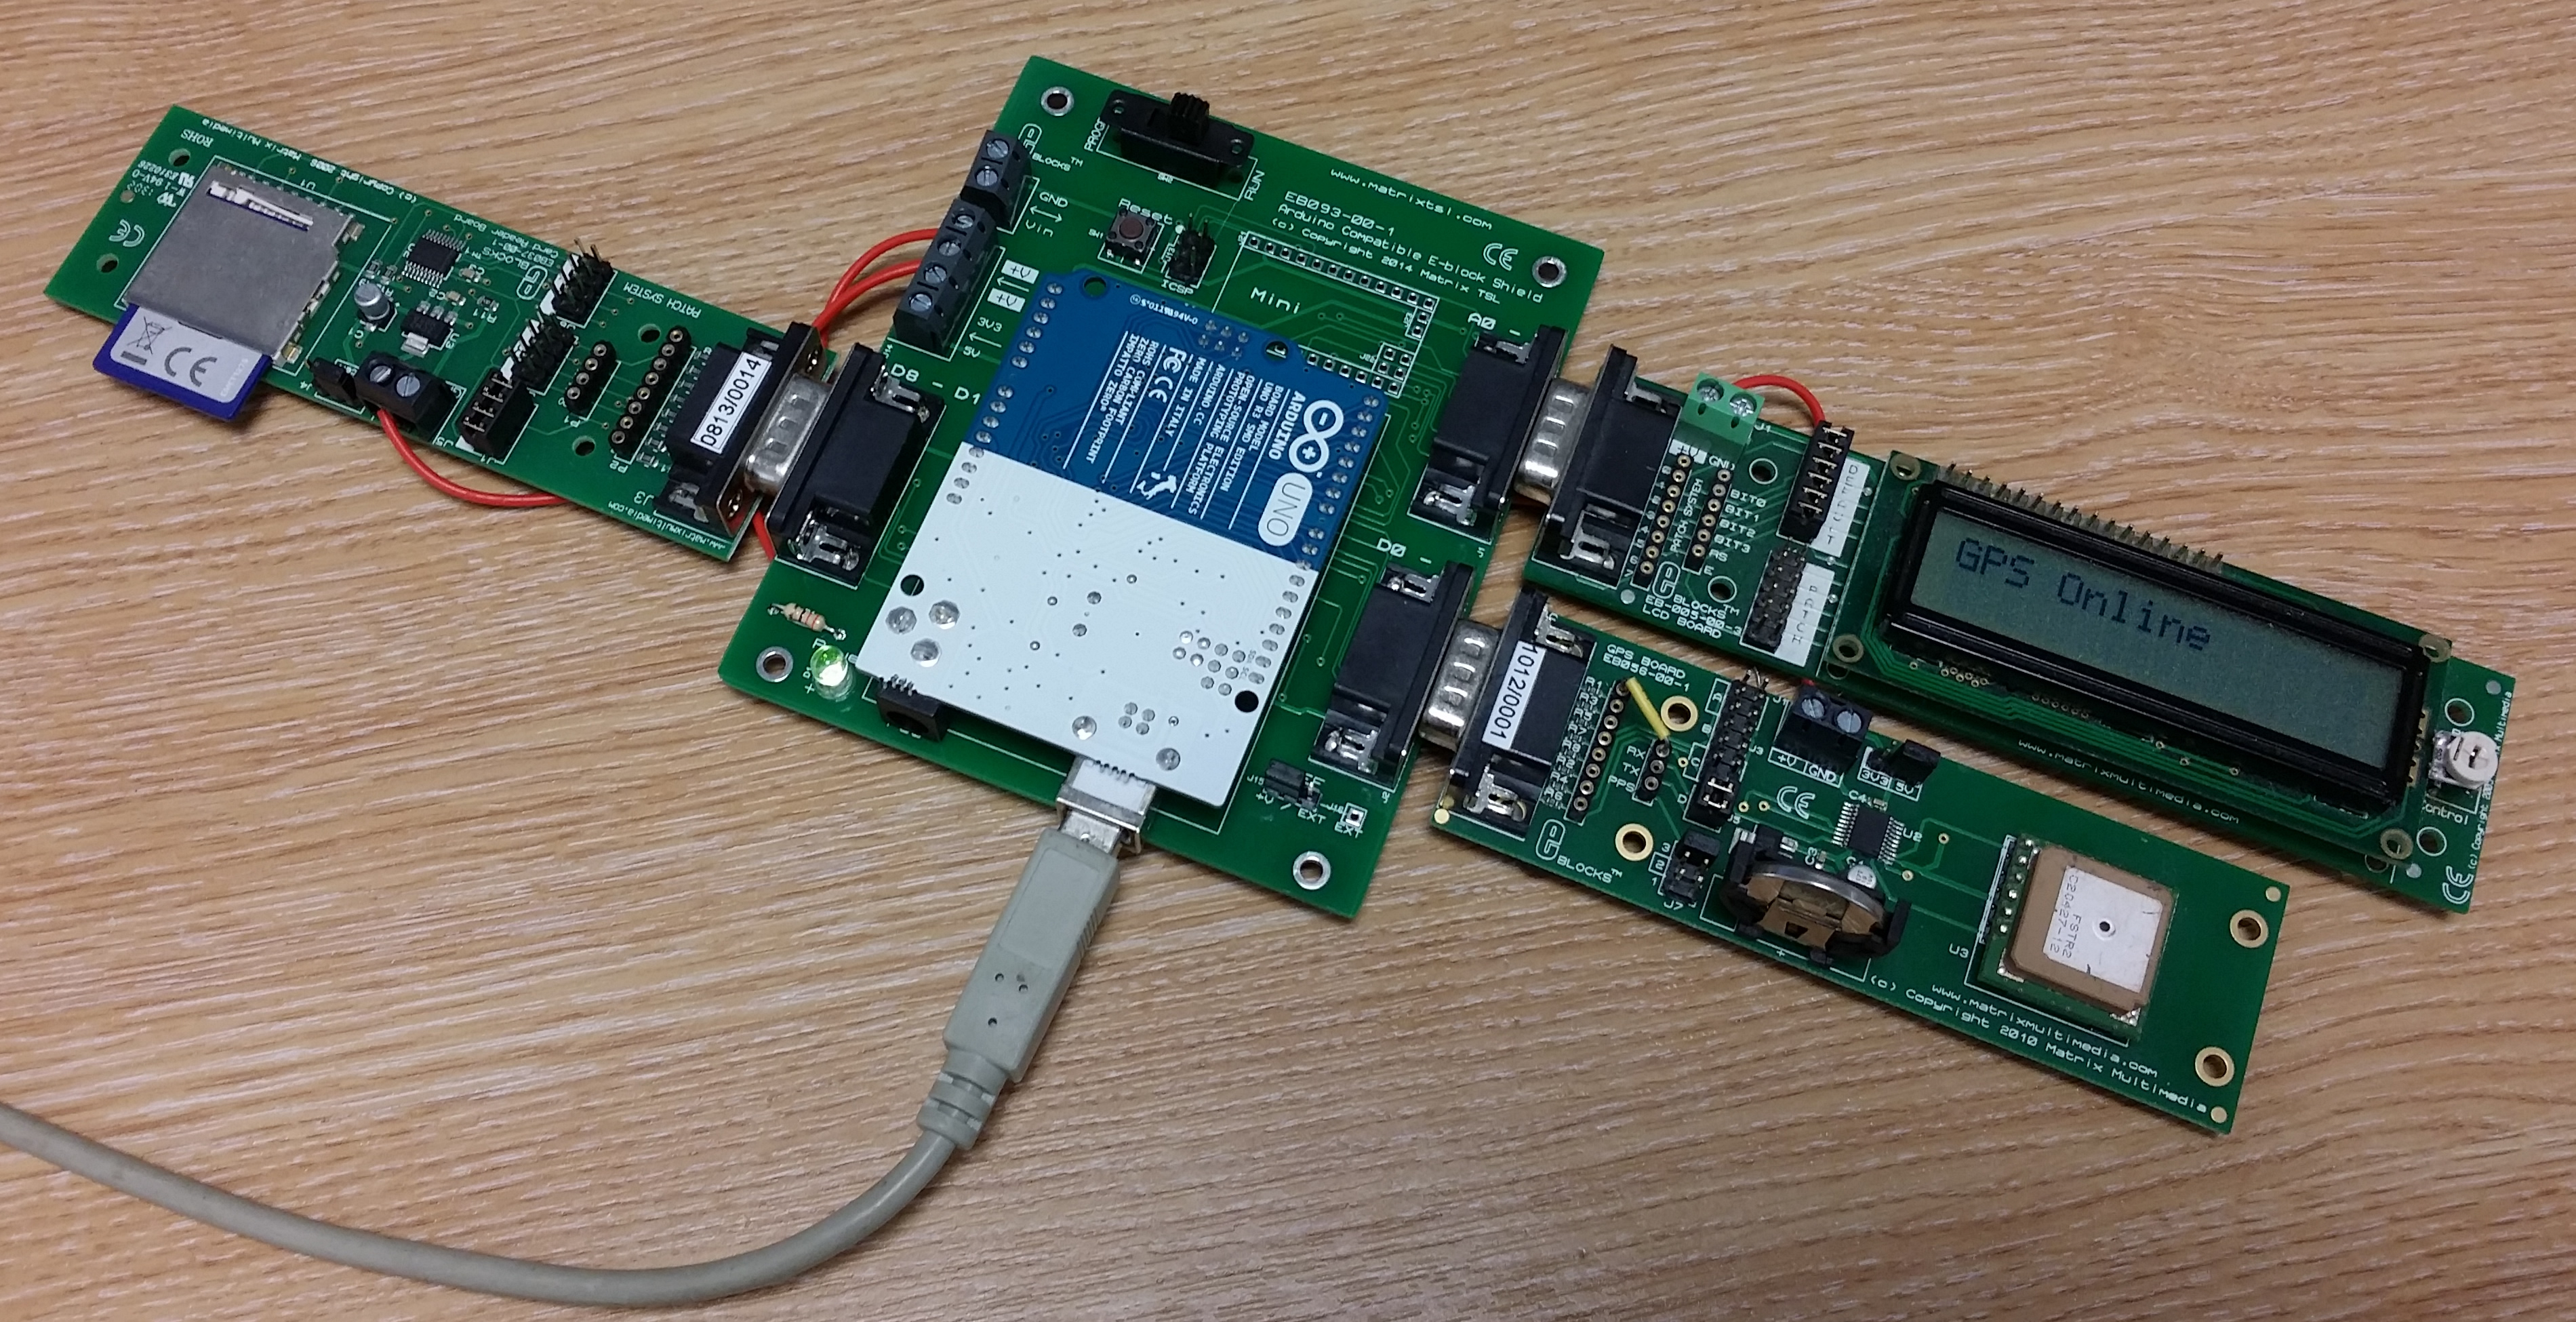
Parts List
- Arduino Uno
- EB093 E-blocks Arduino Shield
- EB056 GPS Board
- EB005 LCD Board
- EB037 SD Board
- SD Card
The GPS sends a message string to the microcontroller every second, which contains all the details relative to position, velocity, course over ground etc. The GPS component uses a UART based receive interrupt to allow the GPS data to be automatically fed through into a set of global variables that can be accessed by using the GPS component macro function calls. Any details that are not
needed in your program can be turned off by editing the defines section of the component using the custom code feature. This allows you to squeeze as much functionality into your program as possible without using code for unwanted GPS records.
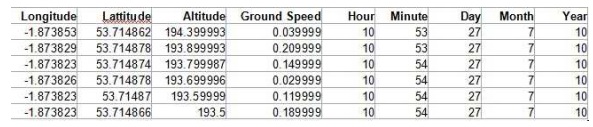
Using the GPS and Card E-blocks together allows for journeys to be logged including speed and height above sea level. The journey coordinates can also be plotted using software such as excel
and combined with a map image to show the exact route of the journey. The example initialises the card and then creates a file called ‘log.csv’. If this file already exists on the card then the data will be appended to the end of the file. A string is then created on the microcontroller which is made up of the values passed from the GPS component. Once the string is created it is written to the end of the file on the card. This whole process then repeats every ten seconds. If an error is detected then the program will loop back to the start and try again.
Of course the E-blocks circuit is quite large so once you have the system up and running it is then possible to use the E-blocks data sheets to collect the circuit schematics and create your own custom condensed board. The Arduino hardware can be powered via the USB connection or using a 6-12V battery via the 2.1mm DC socket.
Here is an example output from the program.
Using Logged GPS Data to Plot on Google Maps
One application for the data you log is to plot the journey you made on Google maps. Google have a facility called fusion tables which you can use to upload .csv files to their database and then plot the data on Google maps for easy viewing.
To do this you require a Google account. Navigate to the Google fusion tables website at http://tables.googlelabs.com/Home , from here you can log in to your Google account.
Select to upload a new table at the left hand side, just under the ‘Google fusion tables’ logo. Navigate to the file located on the SD card and select to upload it. Once you have named and uploaded
the file you will be able to access it via the fusion tables menu. Once into the spreadsheet there will be an “Edit” menu which you should navigate to, and access the “Modify Columns” selection. The first column that will be selected to be modified will be the longitude column, on the right hand side will be a drop down called “Type”, it should be changed from Normal -> Location. After this has happened an extra couple of boxes should appear underneath, make sure the box labelled “Two column location” is ticked and that latitude and longitude are the columns selected.
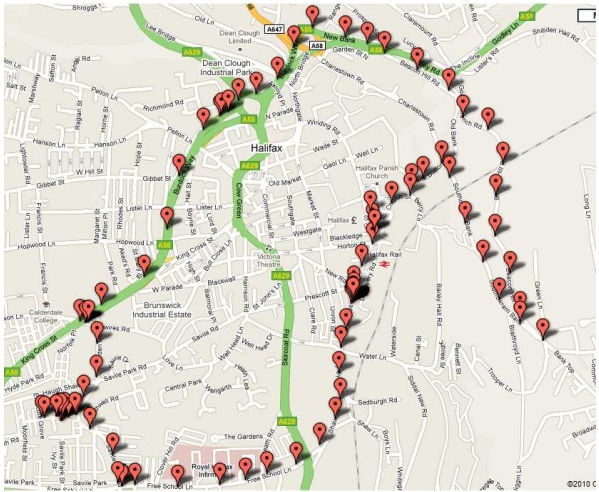
Navigate to the “Visualize” menu and select the option labelled “Map”. This will now plot your coordinates on a Google Map. On the next page is a map we did here at Matrix using this method, it
shows a short drive around our home town.
Flowcode GPS Tracker Source Code
11,222 total views, 1 views today
Related Posts


About The Author
BenR
Embedded engineer with experience in Cybernetics (HMI), Robotics, Mechatronics, Control Systems and Communications using Microcontrollers and Microprocessors.