CodeProfiling
<sidebar>Sidebar: Flowcode Help Overview:ToolsViews</sidebar>
Code Profiling Introduction
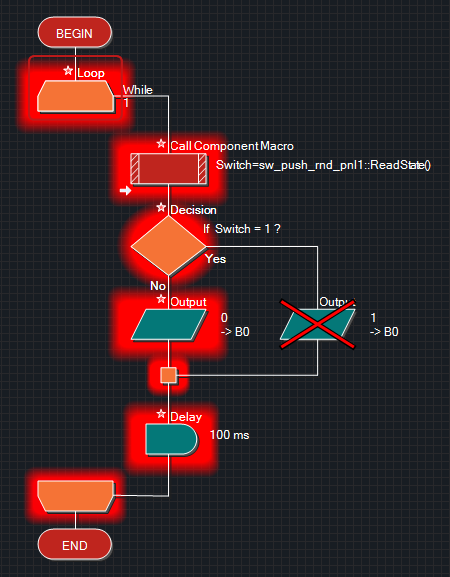
Code profiling is a tool for identifying bugs within code and also alerting programmers of redundant code. When users simulate their program, Flowcode will highlight the icons that are 'hit', the frequency at which they are hit, and also notiy which icons have never been hit.
Activating Code Profiling
Code profiling is activated from the top toolbar with the following icon File:CodeProfilingIcon.png Once activated, run the simulation as normal and you will see the glow appear around icons that have been hit. A cross will appear over any icons that have not been executed.
Here we can see that the 'yes' branch of the switch statement has not been executed, and so the output B0 icon, has also not been executed. This could be due to a bug in the code, or as in this example, the switch simply hasn't been pressed yet.
test
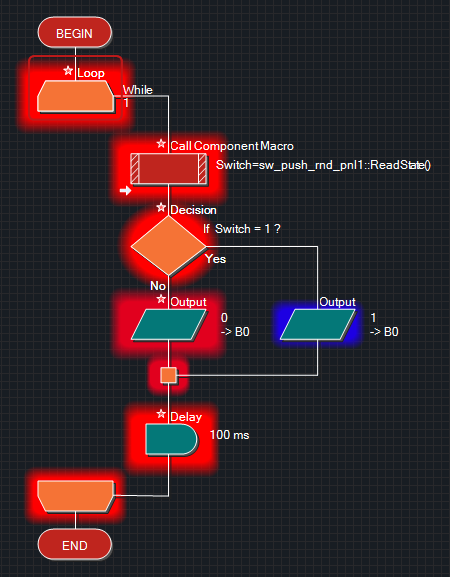
Here we can see that the switch has been pressed now. We know this as the cross has disappeared, and the icon has turned blue. The blue is a visual representation of how frequently this icon has been executed. Red icons are hit every time, and the more blue they turn, the less frequenct they are executed.

