Tools and Views
<sidebar>Sidebar: Flowcode Help Overview:ToolsViews</sidebar> The Flowcode environment consists of a main work area in which the flowchart windows are displayed, several toolbars that allow icon and components to be added to the flowchart application, windows that allow the status of the microcontroller and attached components to be viewed and windows that display variables and macro calls when the flow chart is being simulated.
From the View menu you are able to customise Flowcode to hide and display panel windows such as the Dashboard Panel, System Panel, Properties Panel, Component Debugger and much more, you can also show / hide the Toolbars referenced as Toolboxes, e.g. the 'Main Toolbar', 'Components Toolbar' or rather Toolbox, as well as the 'Icons Toolbar' otherwise known as the 'Command Toolbox'
Video instructions
See the Accessing and Arranging Flowcode Panels video to learn how to organize the application to your preference and manage your work space effectively for optimal productivity and ease of access.
Watch the Toolbars and Buttons video to learn how to use each toolbar effectively as well as learning specific details and functions of each toolbar button.
Finally, view the Tabbed Flowcharts and Macros video to see how to control the interface when managing macros, from tabbed flowcharts and macros to viewing two macro flowcharts on one screen.
| FXa7LJsRvAs}} | 9c6FIZTfGmA}} | |
| {{#ev:youtube|c0d47BSkKS4}} | ||
1) Icons Toolbar
Drag and drop icons from this toolbar onto the main flowchart window to create your flowchart application.
2) Components Toolbar
This toolbar displays the external components that can be connected to a microcontroller. Click on a component and it can be added onto either the Dashboard Panel or the System Panel and will be automatically connected to the microcontroller in the Chip view. The pin connections and properties of the component can then be edited.
Docking and undocking toolbars
The toolbars can be undocked from the default position and either left free floating, or can be docked to the menu bar, the sides or the bottom of the Flowcode window.
To undock a toolbar simply click and hold on the toolbar grab bars if docked, or the caption bar if undocked and drag the toolbar to its new position.
3) Chip View
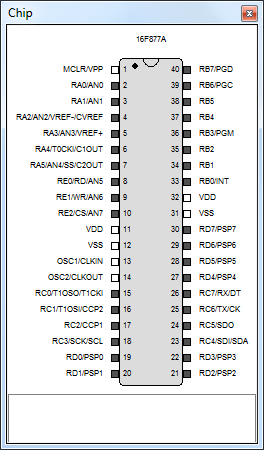
The current microcontroller is displayed in this window. When the flowchart is being simulated, the state of the microcontroller I/O ports are shown on the microcontroller as red and blue for high and low outputs respectively.
4) Flowchart Window
The icons that make up the flowchart are displayed in this window. In addition, the icons that make up a macro are shown in their own separate window. The Main flowchart window is always visible and the macro windows can be shown and hidden as needed.
5) System Panel
The System Panel provides a real-world framework on which to load Flowcode components. It then shows how these components perform during simulation of the current program. It can be customised by adding different background layouts, grids, images etc.
6) Dashboard Panel
The Dashboard Panel provides another framework on which to load Flowcode components. It is usually used for buttons to control components on the System Panel. It can also be customised by adding different background layouts, grids, images etc.
7) Project Explorer
The project explorer allows you to easily manipulate the key constituents of your project. Left clicking on the arrow or right clicking on the various objects in the explorer will bring up a menu relevant to that object. The 'Macro' and 'Components' icons can be dragged into the main window to be placed as icons.
8) Icon Lists
This window shows a list of the icons that: have been bookmarked; are set as breakpoints; are search results or have shown to cause an error after compilation. Left clicking on the arrow or right clicking on the various objects in the icon list will bring up a menu relevant to that object.
9) Simulation Debugger
This window appears when simulating a flowchart, it shows the current macro being simulated as well as the values of any variables selected, the values of the variables are updated for every command simulated but does not update when running the simulation 'As fast as possible'.
When simulating a flowchart, the values of any variables used can be seen in this view. The values of the variables are updated for every command simulated but the view is not updated when the simulation is running at full speed.
10) Main Toolbar
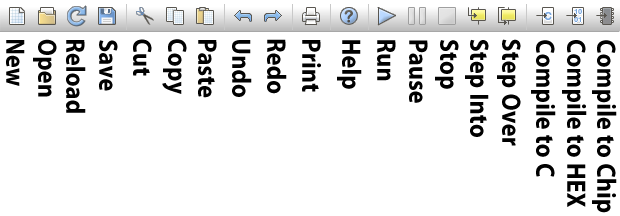
Use this command to display and hide the Toolbar, which includes buttons for some of the most common commands in Flowcode, such as 'Open' (File > Open), 'Print' (File > Print) as well as Compiling the flowchart to Chip, HEX and C. You can even control simulation by running, pausing and stopping simulation using this toolbar as stepping into and over icons to simulate step by step.
11) Status Bar
Use this command to display and hide the Status Bar displayed at the bottom of the Flowcode window, which describes the action to be executed by the selected menu item or depressed toolbar button, and keyboard latch state. A check mark appears next to the menu item when the Status Bar is displayed.
12) Zoom Level
The currently selected Zoom level is displayed on the right side of the Status Bar. You can change the 'Zoom' using keyboard shortcuts such as F2 to 'Decrease' the zoom, F3 to 'Increase' the zoom and F4 to set the zoom at '75%' you can also select the options in the 'Zoom' sub-menu in the 'View' menu (View > Zoom > ), this menu also displays the 'Current zoom' level and allows you to change the zoom to 25%, 50%, 75% or 100% as well as the ability to 'Zoom to Fit' and 'Zoom to Fit Width'.


